Case Study:
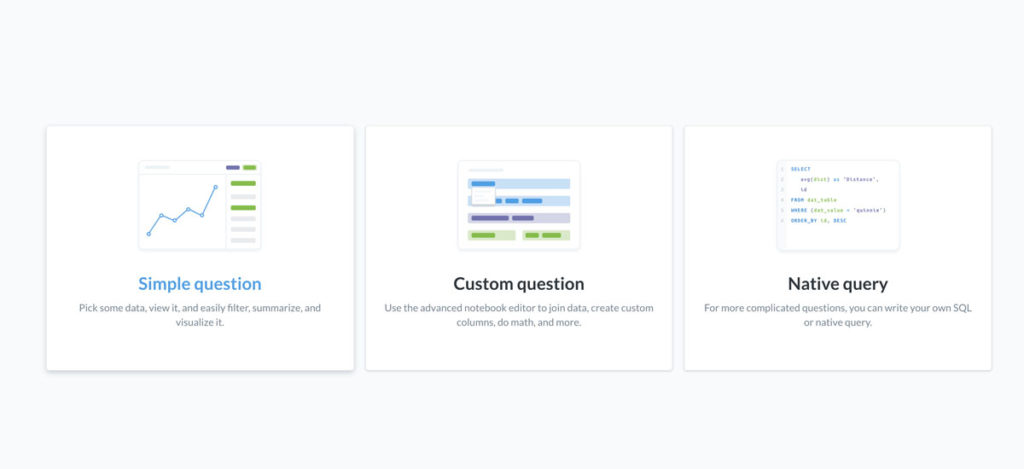
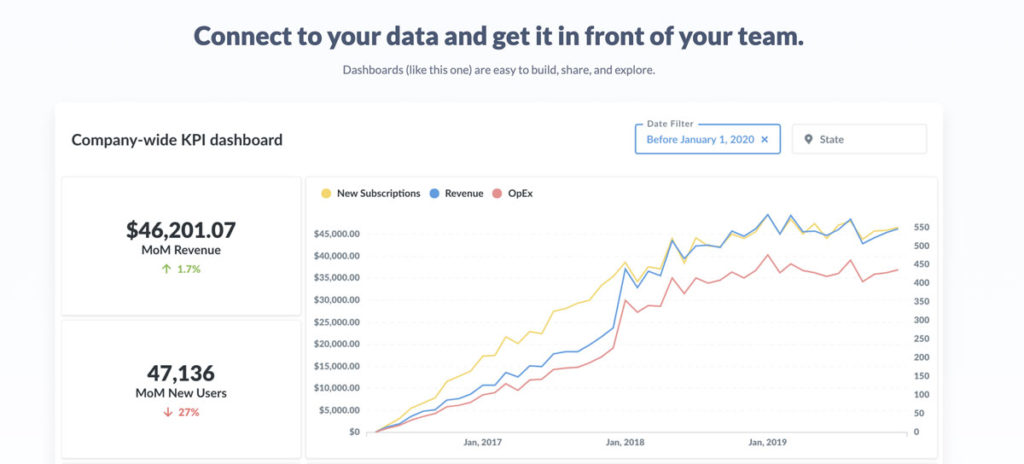
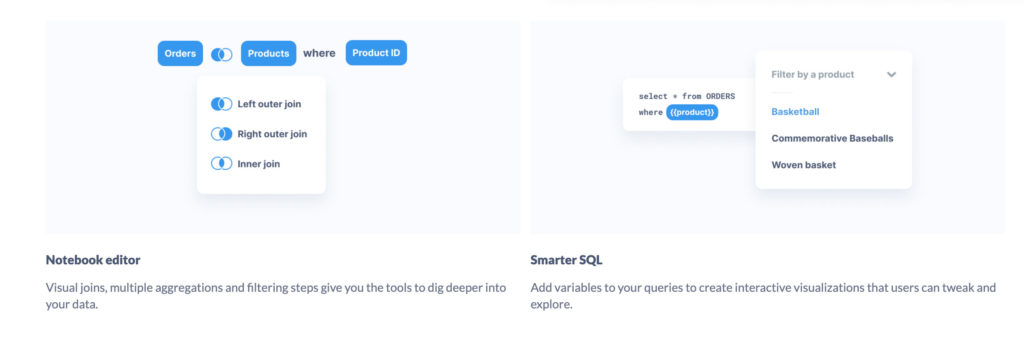
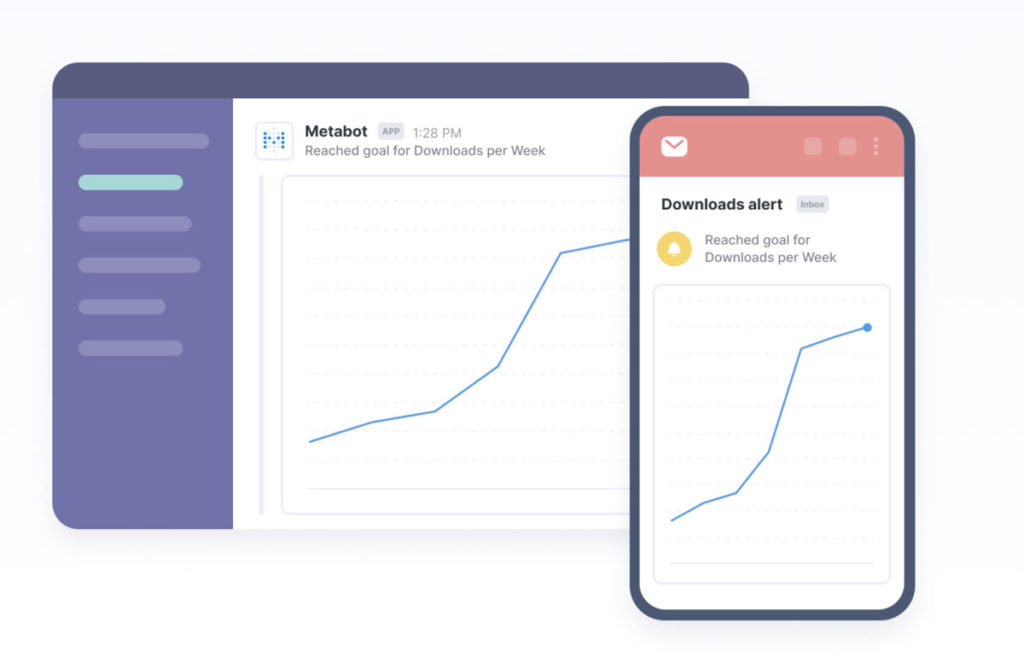
CanPrev Natural Health Products needed a data reporting and analytics tool that stakeholders, managers, sales team and VPs could use to visually check and report data for sales trends, revenue, comparisons etc instead of relying on the Development team to provide data reports. When I was handed this project, the general idea was to create this using Metabase (an open source data analysis tool) that can be connected to different datasets to run queries more easily as an end user. The end user wouldn’t need to know SQL and would only need to visually FILTER and SUMMARIZE the data they would like to see. These data reports can be downloaded as .xlsx, .csv files and the questions created can be saved, sent as notifications and alerts as and when an end user needs them.
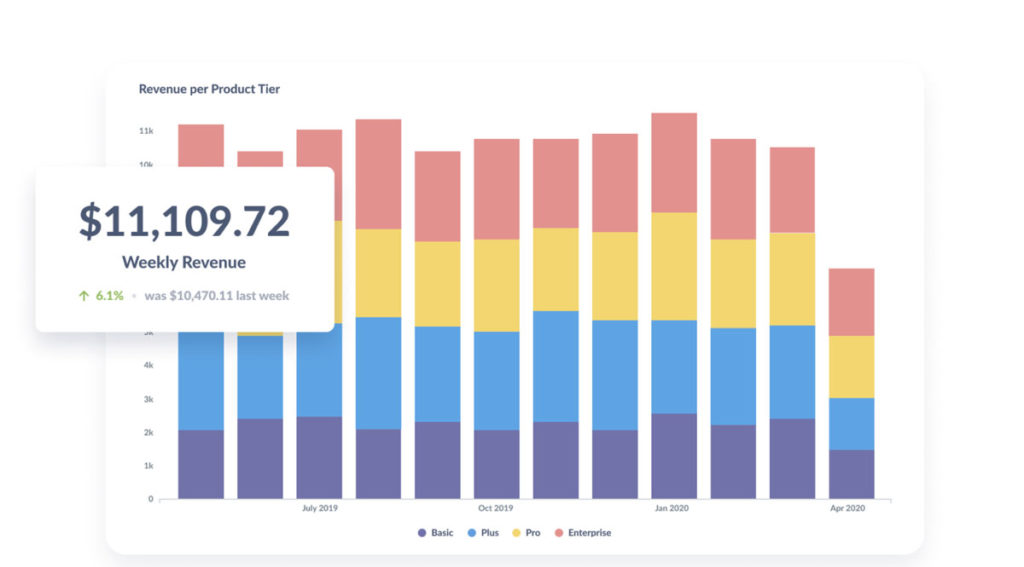
Note: I would not be able to share screenshots of what the CanPrev data analytics tool looks like because of client confidentiality but here are a few general screenshots of what the data analytics tool can do.
Live Website: CanPrev Data Analytics Tool
Tech Stack: AWS Elastic Beanstalk environment, Database – RDS, Metabase Tech stack – Javascript, React, Docker
Roles and responsibilities:
Installed this open-source data analytics tool on company’s sub domain and worked on the development of Metabase environment on AWS. Once set up, connected different datasets using RDS and trained employees on creating simple and complex queries all using the easy user interface on the data tool dashboard. I’m currently maintaining this application as well for updates, bugs etc. This tool has been very successful as the VPs, marketing managers, sales team, customer service manager and finance department use the tool everyday for daily analytics and reporting.